• EN TW
LOGO
PRODUCT CONSULT
EN
EN TW
Product Consult
About EZconn
Overview
About Us
Capabilities
Careers
News
Sustainability
Overview
Sustainability Practices
Government
Stakeholders
Questionnaire
Sustainability Report
INVESTOR
Overview
Financial Information
Shareholders' Corner
Contact & Inquiries
PRODUCTS
Overview
Fiber Optics Products
RF Products
Application
Overview
Next generation Passive Optical Network (PON)
Data Communication
Satellite Communication
5G
IT DataCom
AutoMotive
AeroSpace
Broad Band
Health Care
LOGO
Let’s Move Towards A New Future TOGETHER
PRIVACY PARTNER LINKS
Contact Us
+886 2-2808-6333Inquiry@ezconn.com
13F., No. 27-8, Sec. 2, Zhongzheng E. Rd., Tamsui Dist., New Taipei City 25170, Taiwan (R.O.C.)
Sustainability
Sustainability Practices
Environmental Protection
Greenhouse Gas and Energy Management

Greenhouse Gas and Energy Management

Environmental Protection
DATE
2026.11.18

EZconn is committed to effective greenhouse gas management and continuous emissions reduction. In accordance with ISO 14064-1:2018 and ISO 14064-3:2019, the Company has established the Greenhouse Gas Inventory Management Procedures and uses inventory data to drive our carbon reduction strategies and action plans.  


EZconn completed our first greenhouse gas inventory in 2022 and designated the inventory results of that year as the original baseline year for carbon reduction. In 2024, the organizational boundary was revised to include leased dormitories for foreign employees. As this change resulted in a variation in greenhouse gas emissions exceeding the materiality threshold of 3%, the baseline year was reset to 2024, which will serve as the reference year for future carbon emission management and performance evaluation.  


The inventory results indicate that EZconn's greenhouse gas emissions are primarily generated from energy consumption, with purchased electricity representing the largest emission source. Accordingly, the Company regards energy management as the foundation of our greenhouse gas reduction efforts. In addition to adopting a data-driven approach to monitor energy consumption and carbon reduction performance, the Company promotes an energy-saving culture in daily operations, replaces aging equipment, and introduces green manufacturing processes and power recovery technologies to improve energy efficiency, reduce the climate impacts of our operations, and advance our low-carbon transition.
Reduction Targets

The greenhouse gas inventory results over the past three years indicate that EZconn's primary carbon emission hotspot is purchased electricity. Accordingly, carbon dioxide emissions calculated from monthly electricity consumption are used as the basis for measurement, and electricity-related carbon emission intensity per labor hour (kg CO₂e/labor hour) is adopted as the management indicator to continuously monitor and control electricity use efficiency and carbon emission intensity.  


For 2025, EZconn established a target to reduce electricity-related carbon emission intensity per labor hour by 1% compared with the previous year. Actual performance showed that the electricity-related carbon emission intensity per labor hour decreased by 11% at the Head Office and 16% at the Shangda Plant compared with 2024, achieving the annual reduction target.  


2026 Target

Reduce electricity-related carbon emission intensity per labor hour by 10% compared with the 2024 baseline (Head Office and Shangda Plant).

Carbon Reduction Measures

EZconn recognizes our responsibility for environmental sustainability. At the current stage, our greenhouse gas reduction efforts are primarily focused on Scope 2 emissions (purchased electricity), which represent the Company's major emission source. The Company is committed to implementing energy conservation and carbon reduction measures by optimizing daily operational management and upgrading energy-efficient equipment to reduce overall energy consumption.  


In 2025, EZconn invested a total of NT$1,042,820 in energy-saving projects, achieving a total greenhouse gas reduction of 41 metric tons of CO₂e and reducing energy consumption by 311 gigajoules (GJ).


  • Energy Conservation Culture: Promote energy-saving practices such as turning off lights and computers after work to reduce unnecessary energy consumption in daily office operations.
  • System Efficiency Optimization: Regularly review contracted electricity capacity, optimize air-conditioning zoning, and adjust lighting circuit configurations to improve overall energy efficiency across facilities.
  • Equipment Maintenance Management: EZconn has established equipment management, maintenance, and servicing procedures and related documentation. Equipment conditions are regularly inspected, and preventive maintenance is performed by qualified service providers to ensure production and facility equipment operate at optimal efficiency and to prevent additional energy consumption resulting from equipment aging or malfunction.

左右托拉查看表格資訊

Energy Conservation Measure

Amount Invested

Carbon Emissions Reduction(tCO2e)

Energy Savings (GJ)

Daily Lunch Break Power Saving

$0

23

174

LED Lighting Replacement

$325,470

13

100

Air Conditioner Replacement

$717,350

5

37

CNC Regenerative Power System

$0

0

1

Total

$1,042,820

41

311

Note: Unit conversions are based on the methodology published by the Energy Administration, Ministry of Economic Affairs. The 2024 electricity emission factor is 0.474 kg CO₂e/kWh.

Greenhouse Gas Emissions

test

EZconn conducts our greenhouse gas inventory in accordance with the WBCSD/WRI Greenhouse Gas Protocol and ISO 14064-1:2018. The inventory covers our geographical boundary, and the organizational boundary is determined using the operational control approach, encompassing the Head Office, Shangda Plant, Lide Plant, Hsinchu Office, and employee dormitories. 2024 is designated as the baseline year. Greenhouse gas emissions are calculated and verified.


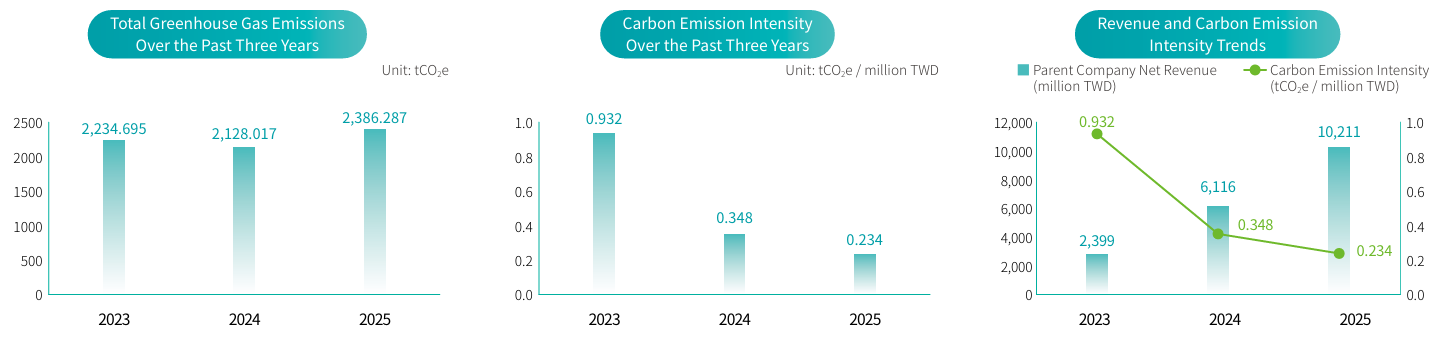
As EZconn's business continued to expand, parent company net revenue increased from NT$2399 million in 2023 to NT$1,0211 million in 2025, representing an increase of 326% over the three-year period. During the same period, carbon emission intensity declined from 0.932 tCO₂e per NT$1 million in revenue to 0.234 tCO₂e per NT$1 million in revenue, representing a 75% reduction over three years. These results indicate that the Company's revenue growth has exceeded the growth in carbon emissions, while operational efficiency has continued to improve, resulting in a year-by-year reduction in carbon emission intensity.

Greenhouse Gas Emissions and Emission Intensity Over the Past Three Years

左右托拉查看表格資訊

Year

Scope 1 (tCO₂e)

Scope 2 (tCO₂e)

Scope 3 (tCO₂e)

Total (tCO₂e)

Carbon Emission Intensity (tCO₂e / million TWD)

2025

110.4318

1,679.0098

596.8454

2,386.287

0.234

2024

103.2070

1,518.3245

506.4851

2,128.017

0.348

2023

128.5707

1,599.9239

506.2007

2,234.695

0.932

Note 1: The data covers the Head Office, Shangda Plant, Lide Plant, Hsinchu Office, and employee dormitories.

Note 2: Gasoline and diesel consumption for company vehicles is based on refueling records. Diesel consumption for forklifts is based on refueling records. Liquefied petroleum gas (LPG) and carbon dioxide consumption is based on procurement records. Electricity consumption is based on electricity bills.

Note 3: Greenhouse gas emissions are calculated using the following formula: Greenhouse Gas Emissions = Activity Data × Greenhouse Gas Emission Factor × GWP. Greenhouse gas emissions are consolidated using the operational control approach. Greenhouse gas emission factors and GWP are based on the greenhouse gas emission factors announced by the Ministry of Environment's Greenhouse Gas Emissions Information Platform on February 5, 2024, and the GWP values published in IPCC AR6 (2022), Working Group III. The electricity emission factor of 0.474 kg CO₂e/kWh is based on the value published by the Energy Administration, Ministry of Economic Affairs.

Note 4: Greenhouse gas emissions include CO₂, N₂O, and CH₄. Scope 2 emissions are calculated using the location-based method.

Note 5: Parent company net revenue was NT$10,211 million in 2025, NT$6,116 million in 2024, and NT$2,399 million in 2023.

Scope 3 Inventory Categories and Emissions (Unit: tCO₂e)

左右托拉查看表格資訊

Category

Carbon Emissions

3.3 Emissions from Employee Commuting

113.0093

3.5 Emissions from Business travels

85.2378

4.1 Emissions from Purchased Goods

398.5983

Total

596.8454

Note: Scenario data for supplier logistics is currently under development and has not yet been included in the inventory boundary.

Energy Consumption

EZconn's energy consumption is primarily derived from purchased electricity, accounting for 98% of total energy consumption. Direct energy consumption mainly consists of gasoline and diesel, accounting for 0.62% and 0.52%, respectively, while liquefied petroleum gas (LPG) accounts for a relatively small proportion of approximately 0.002%.


Total non-renewable energy consumption was 12,899.04 GJ, and no renewable energy was used. Energy intensity was 1.26 GJ per NT$1 million revenue, representing a decrease of approximately 34% compared with 2024.


Overall, the Company's energy consumption structure continues to be dominated by purchased electricity. Going forward, we will continue to strengthen electricity management and implement energy-saving measures to reduce energy consumption and greenhouse gas emissions.


Internal Energy Consumption

左右托拉查看表格資訊

Category

Energy Type

GJ

%

Category 1: Direct GHG Emissions and Removals

Diesel

67.358

0.522%

Liquefied Petroleum Gas

0.250

0.002%

Gasoline

79.457

0.616%

Category 2:
Indirect GHG Emissions from Imported Energy

Purchased Electricity

12751.973

98.860%

Total Non-Renewable Energy

12899.038

100%

Total Renewable Energy

0

0%

Total Energy Consumption

12899.038

Energy Intensity (GJ / million TWD)

1.263

Note 1: The calorific values are based on the values announced by the Ministry of Environment. For 2025, the net calorific value is 7,586 kcal/L for gasoline, 8,636 kcal/L for diesel, and 5,993 kcal/L or 10,972 kcal/kg for liquefied petroleum gas (LPG).

Note 2: The electricity emission factor of 0.474 kg CO₂e/kWh is based on the value published by the Energy Administration, Ministry of Economic Affairs for 2024.

Note 3: Energy intensity is calculated by dividing total energy consumption by parent company net revenue (NT$10,211 million).

Explore More
Related Resources

Previous
2026.11.18
Environmental Management
Environmental Protection
Previous
2026.11.18
Waste Management
Environmental Protection
Let’s Move Towards A New Future TOGETHER
+886 2-2808-6333
Inquiry@ezconn.com
13F., No. 27-8, Sec. 2, Zhongzheng E. Rd., Tamsui Dist., New Taipei City 25170, Taiwan (R.O.C.)
About EZconn
About Us
Capabilities
Careers
News
PRODUCTS
Fiber Optics Products
RF Products
Application
Next generation Passive Optical Network (PON)
Data Communication
Satellite Communication
5G
MORE
Sustainability
Sustainability Practices
Government
Stakeholders
Questionnaire
Sustainability Report
INVESTOR
Financial Information
Shareholders' Corner
Contact & Inquiries
PRIVACY
Contact Us
PARTNER LINKS
Copyright ©2025 EZconn Corporation. All RIGHTS RESERVED.

Cookie

We record cookie information to provide customized content and enhance your browsing experience. By continuing to use this website, you consent to our use of cookies.Privacy Policy

Later
Yes, I Agree
Product Consult
Choose the product you’re interested in, complete the form, and our team will contact you right away.
USE THE MENU BELOW TO FIND YOUR PRODUCT
  • Fiber Optics Products
  • RF Products
  • 5G / 6G
  • OSA
  • Wi-Fi 7 / Wi-Fi 8
  • Passive
  • DOCSIS 4.0
  • Advanced Product
  • RF Over Fiber
  • Base Station
  • Lab Adaptors
  • Precision Components for All Categories
  • 9GHz RF over Fiber Module
  • 400G QSFP112 SR4 Transceiver
  • 800G QSFP-DD AOC
  • PRECISION MACHINING
  • Coaxial Transmitting Optical Sub-Assembly
  • Coaxial Dual Transmitting Optical Sub-Assembly
  • Coaxial Dual Receiving photodiode
  • Coaxial broadband photodiode
  • Laser MEMS Scanning
  • MEMS Packaging
  • ST Series
  • FC Series
  • MT-RJ Series
  • MPO Series
  • MU Series
  • LC Series
  • SC Series
  • DAS Adaptors
  • SMPM Adaptors
  • 2.92mm Adaptors
  • DAS Connectors
  • Surge Arrester
  • Shielding Can + RFoF
  • Shielding Can + RFoF
  • MCX Connector
  • SMB Connector
  • Cable Assembly
  • Filter / Attenuator / Isolator
  • F Connector
  • SMA Series
  • wireless communication
  • SMP Connectors
  • XGSPON ONU Tri-OSA
  • 50 OHM/75 OHM Adaptor
  • 7/16 series
  • N Connector
  • XGSPON ONU BOSA
  • XGSPON ONU BOSA with OTDR reflectors
  • Combo PON ONU BOSA
  • G Connector
  • IPEX MHF4 TO SMA Jumper
  • RPSMAM TO RPSMAF Adapter
  • Dual Band Omni Directional Antenna
  • SMPM JACK/JACK ADAPTER
  • Combo PON OLT BOSA
  • ADP-RA2.92M-2.92M RF/Microwave Coaxial Adaptors
  • 2.92F-PCBV-2H Vertical PCB RF Connectors
  • 1.85mm Flexible Microwave Test & Measurement cable
  • 2.4mm Flexible Microwave Test & Measurement cable
  • 2.92mm(K Band) Flexible Microwave Test & Measurement cable
  • 4GHz TOSA
  • ROSA
  • TT BOSA
  • 25GPON ONU BOSA
  • OR VISIT THE PRODUCT PAGE FOR MORE DETAILS
    PRODUCTS
    Next
    Product Consult
    Choose the product you’re interested in, complete the form, and our team will contact you right away.
    Reset
    Send
    Modal4

    NOTICE 提示訊息

    請先登入會員,以繼續執行本次操作!

    取消返回
    NOTICE